Back
Understanding Your Home Screen
Tutorials
Dec 20, 2023
How To Understand The Homepage
If you prefer to watch a video you can watch below. If not, continue scrolling for the full text guide!
We've made it easy to see and understand all of the quick data you may need - at a glance.
Income Viewer

The income viewer allows you to see all - or certain selected - creators at a quick glance. You are able to change the way the data is pulled such as:
This Month
This Year
All Time
Custom Date Range
You're also able to easily filter data by a specific category - such as subs, messages, tips and post revenue. This will allow you to find out how each category is doing and pinpoint your strengths - or weaknesses.
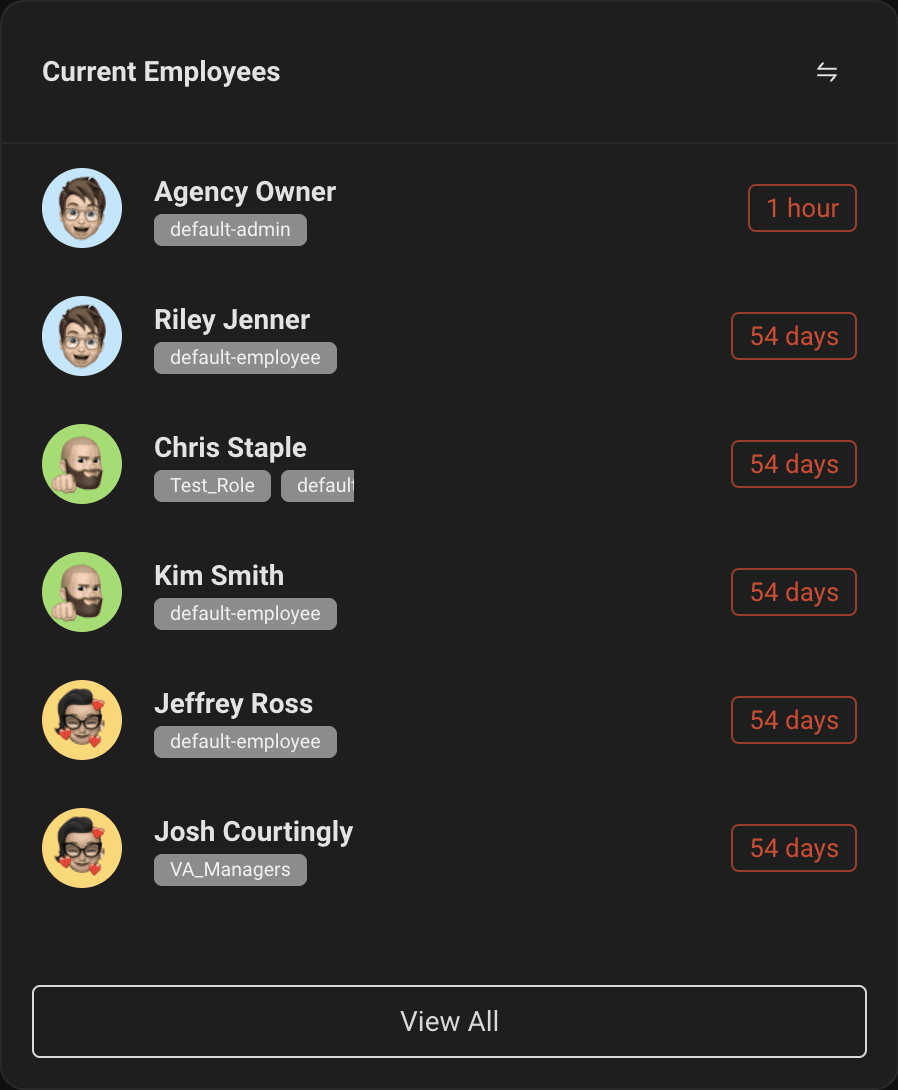
Current Employees

Have a quick glance at the current employees at your agency. You are able to easily determine who is offline and online at a quick glance! A green bar with the time in it means they are currently clocked in for x amount of time. While the red bar means they are clocked out and haven't been seen in x amount of time.
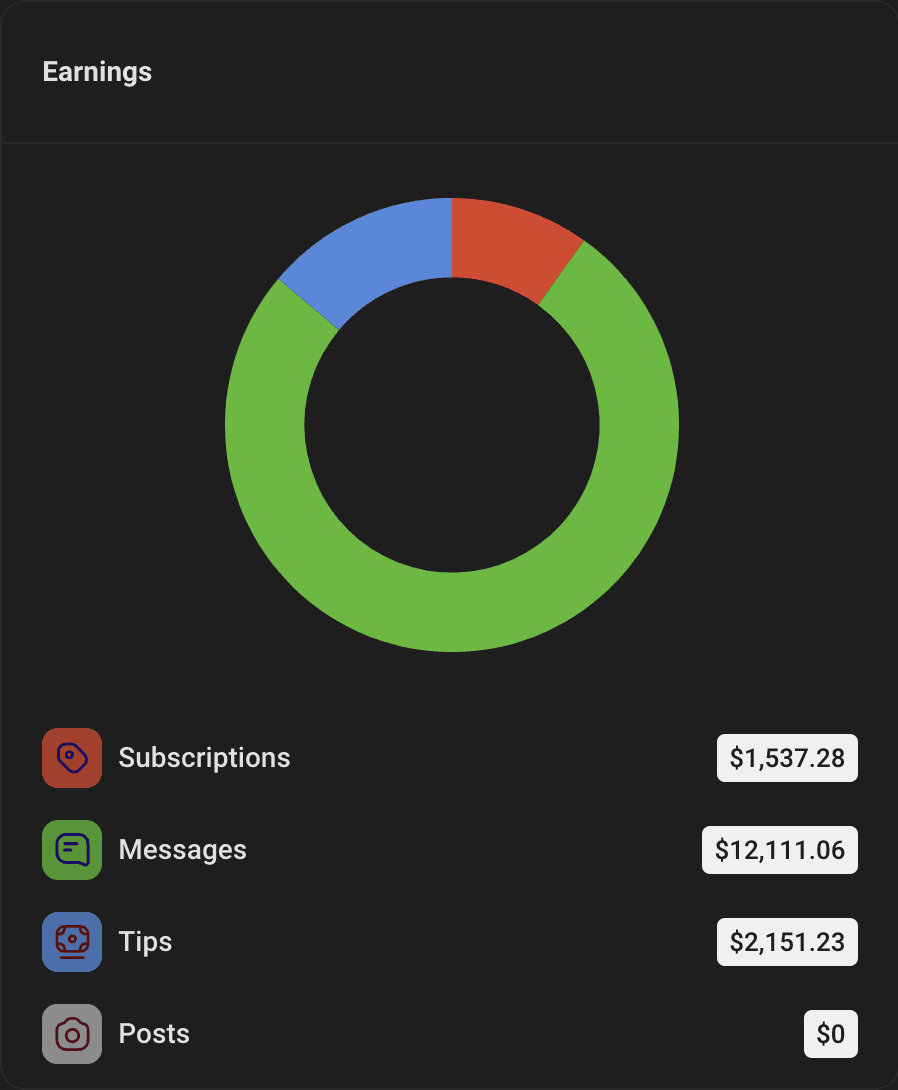
This Month's Earnings

See a pie chart breakdown of your current month across all of your models or a specific one you choose.
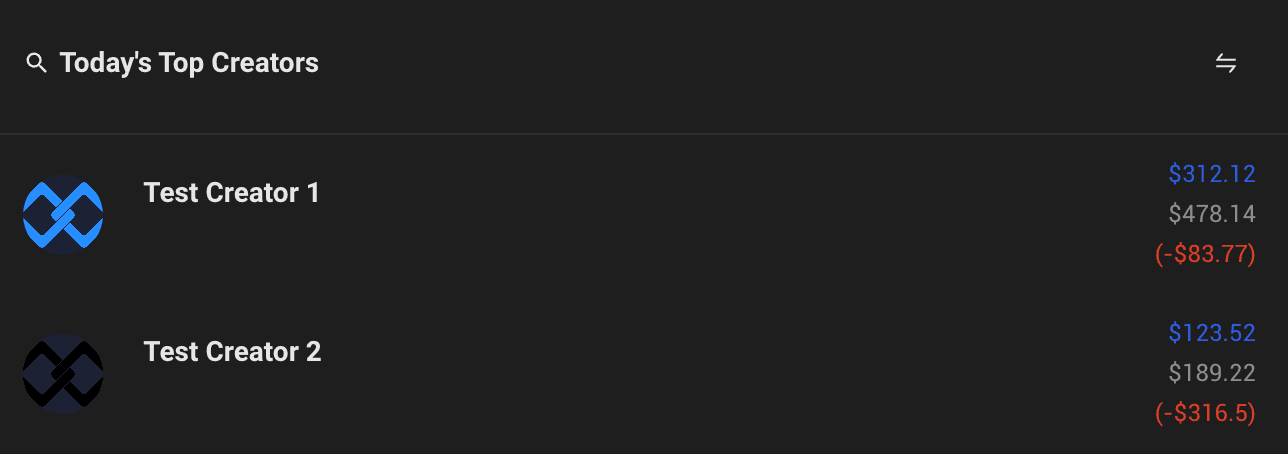
Today's Top Creators

At a quick glance, determine your top creators currently at your agency. You will notice there are 3 revenues in the screenshot above. The top blue line is the current revenue that the model has. The middle grey is the models projected revenue for that day. The green/red numbers below are the positive or negative compared to the day before! This will let you easily check how your models are doing compared to themselves the day before!


